
See the business and the floor, hour by hour.
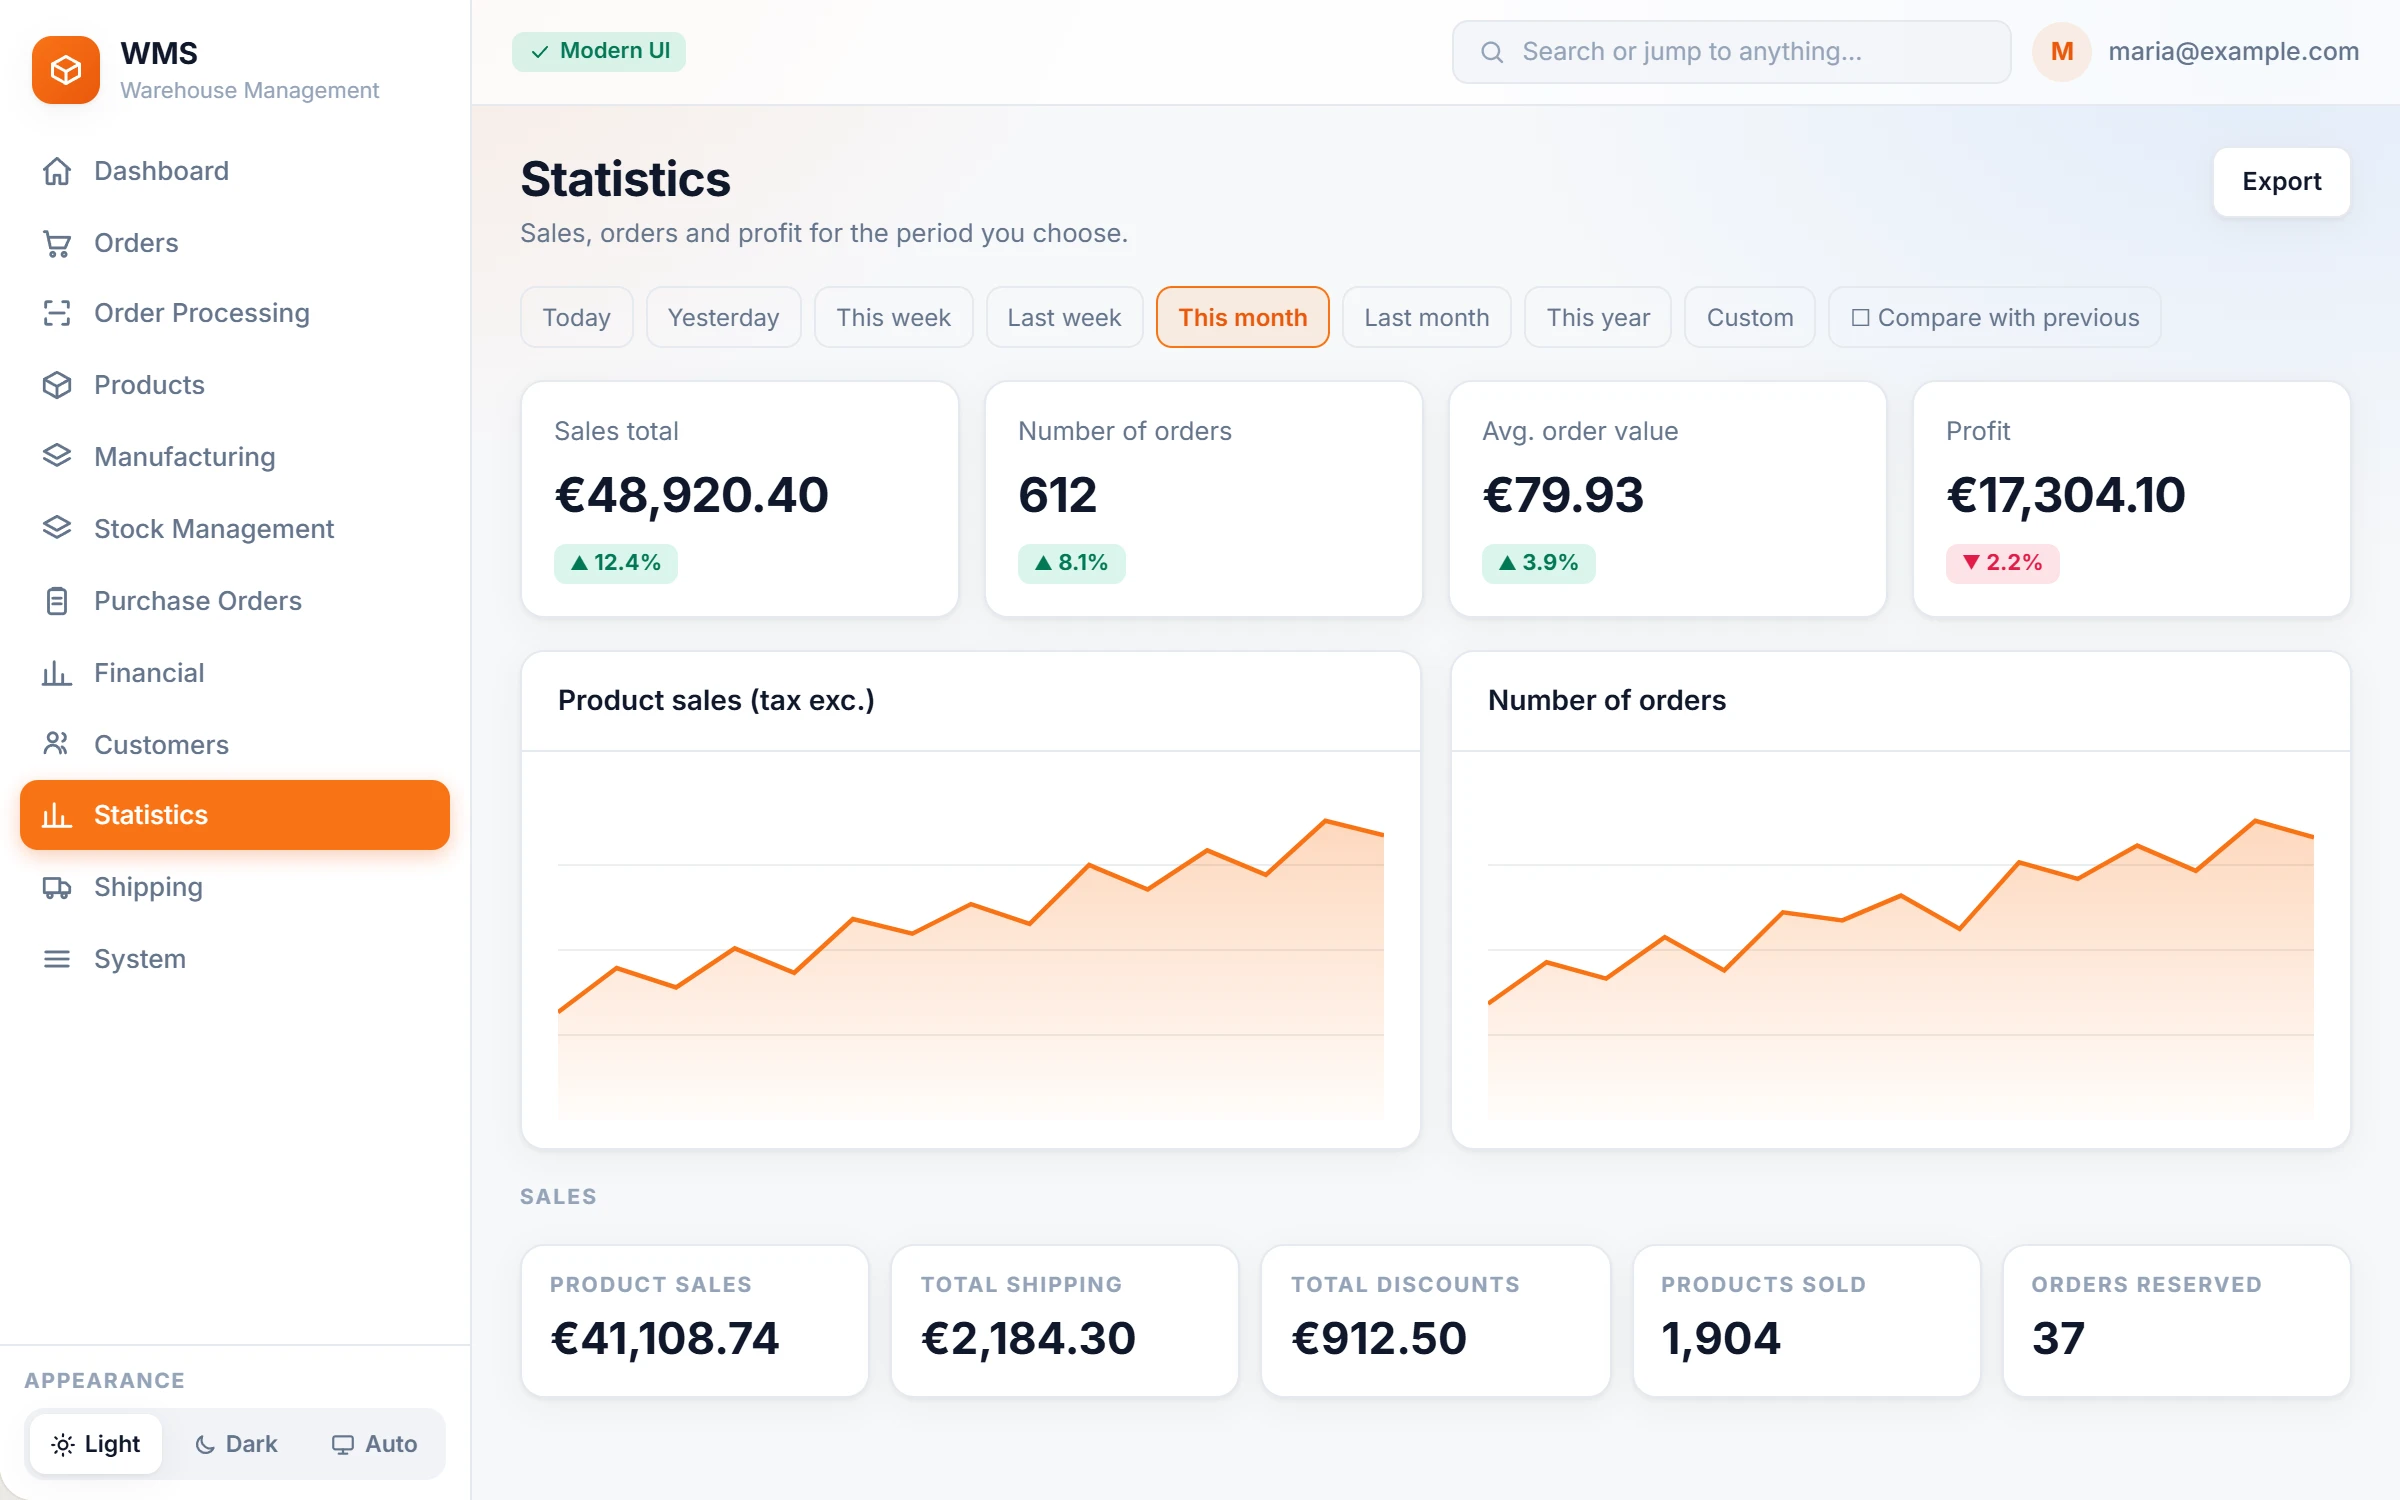
One statistics screen for sales, products, customers, categories, stock, fulfillment and purchasing, and three screens for the team on the floor.
Figures from five places that never agree.
Sales come from each shop's own report, stock from a spreadsheet, and an evening goes on putting them side by side. The question of who picked what yesterday has no answer at all.
How it works in Pulsa
One statistics screen
No more logging in to every shop to add up the figures. Switch between sales and orders, products, customers, categories, stock, fulfillment, purchasing and profit, for the period you choose.
Best sellers and slow movers
See what to reorder and what is tying up money on the shelf, product by product. Best sellers and products with too much stock can be exported.
Sales per channel
Know which shop or marketplace is worth the effort: daily sales count and value, and sales per shop and marketplace.
Who is on the floor
No walking the aisles to find out. Warehouse floor shows who is working right now, Team activity what each person did on a day, and Productivity how people compare over a period.
Stock reports for Romania
No more building them by hand for the accountant: the stock balance and the stock card of a product over a period, the two reports Romanian accounting asks for.
Everything the reports show, from the shop to the floor.
No more stitching figures together from different places: sales and stock for the business, and an honest answer to who did what on the warehouse floor.
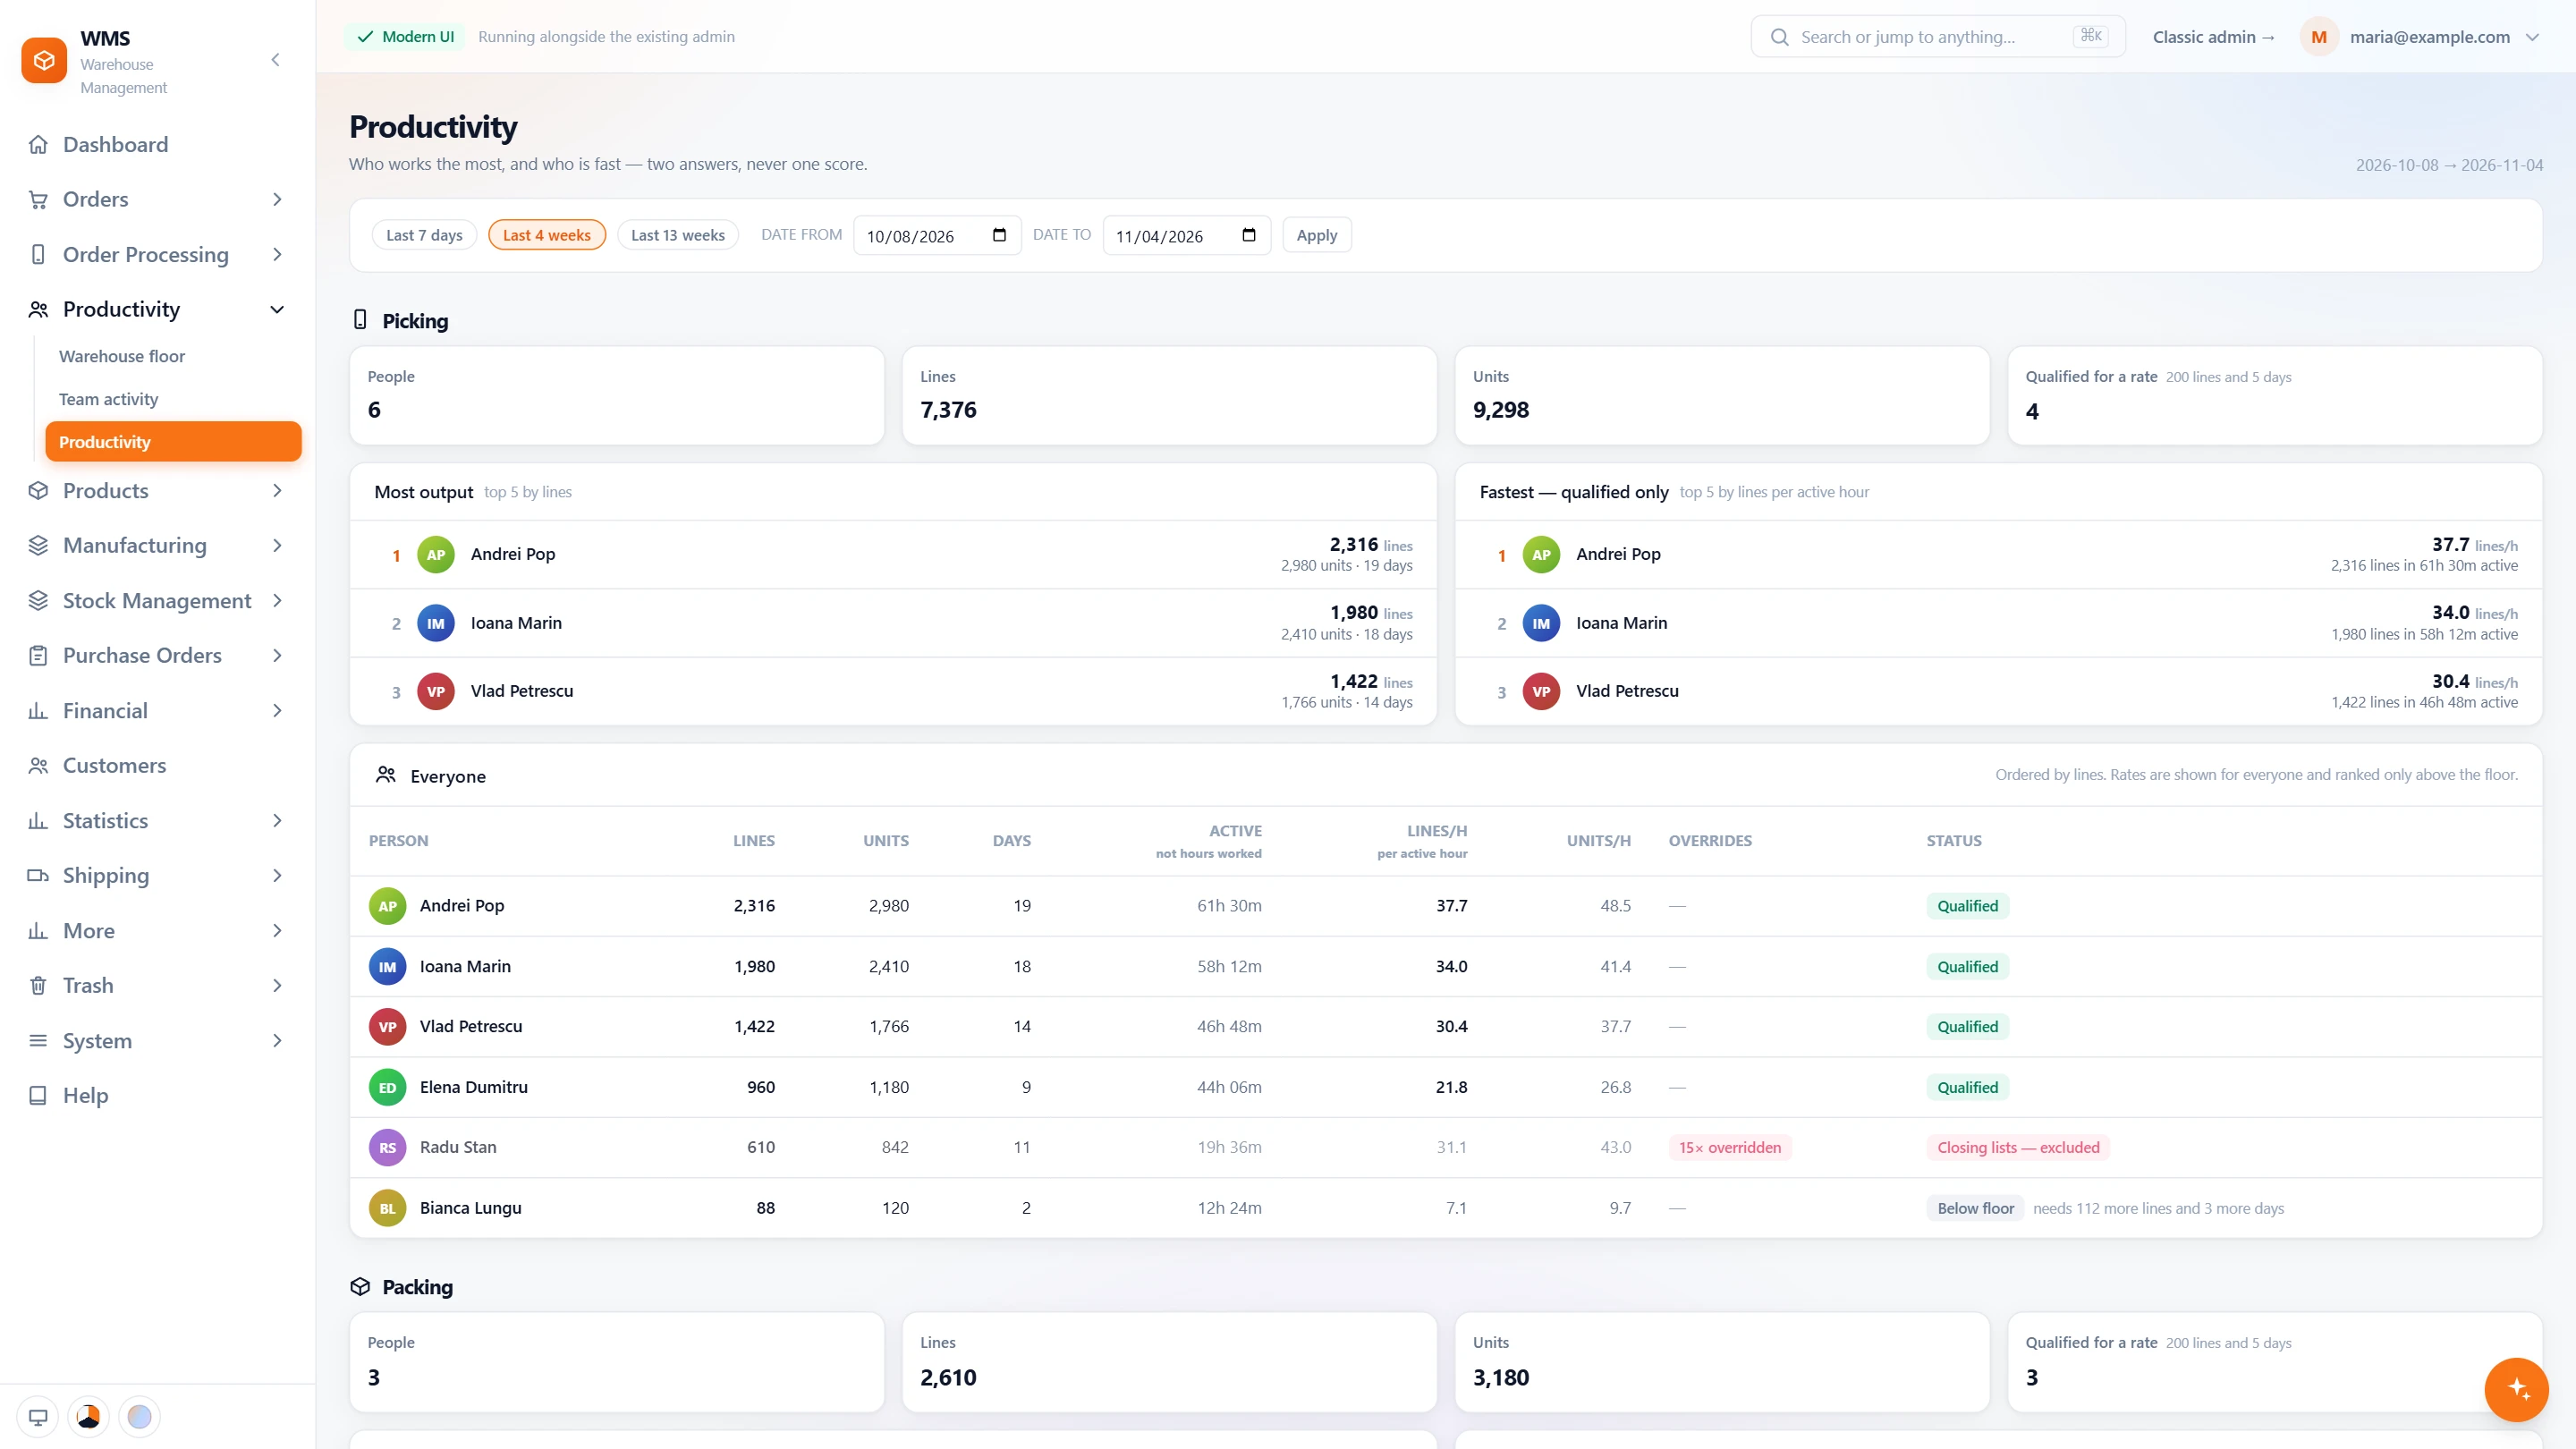
Who works the most, and who is fast
Judging the team by impression is unfair and leads to arguments. These figures come from the scans themselves, so you can see who carries the most work and who is quickest.
- Two answers, never one scoreMost output and fastest are ranked separately, so the busiest picker is never pushed down by a quick one.
- A fair windowCompare over the period that matters to you: last 7 days, 4 weeks or 13 weeks, or any dates you choose, such as a pay period.
- Only real rates countNo one tops the list after a single lucky hour: a rate is ranked only for someone with enough lines and days behind it, and the page says how many more they need.
- Shortcuts caughtSomeone who closes lists by override instead of scanning is marked and left out of the rankings, so the figures stay honest.
- Picking and packingBoth jobs measured the same way: lines, units, days, active hours, lines and units per hour.
- Active is not hours workedNo misreading: active time is first scan to last scan, and the page says so.
What each person did today
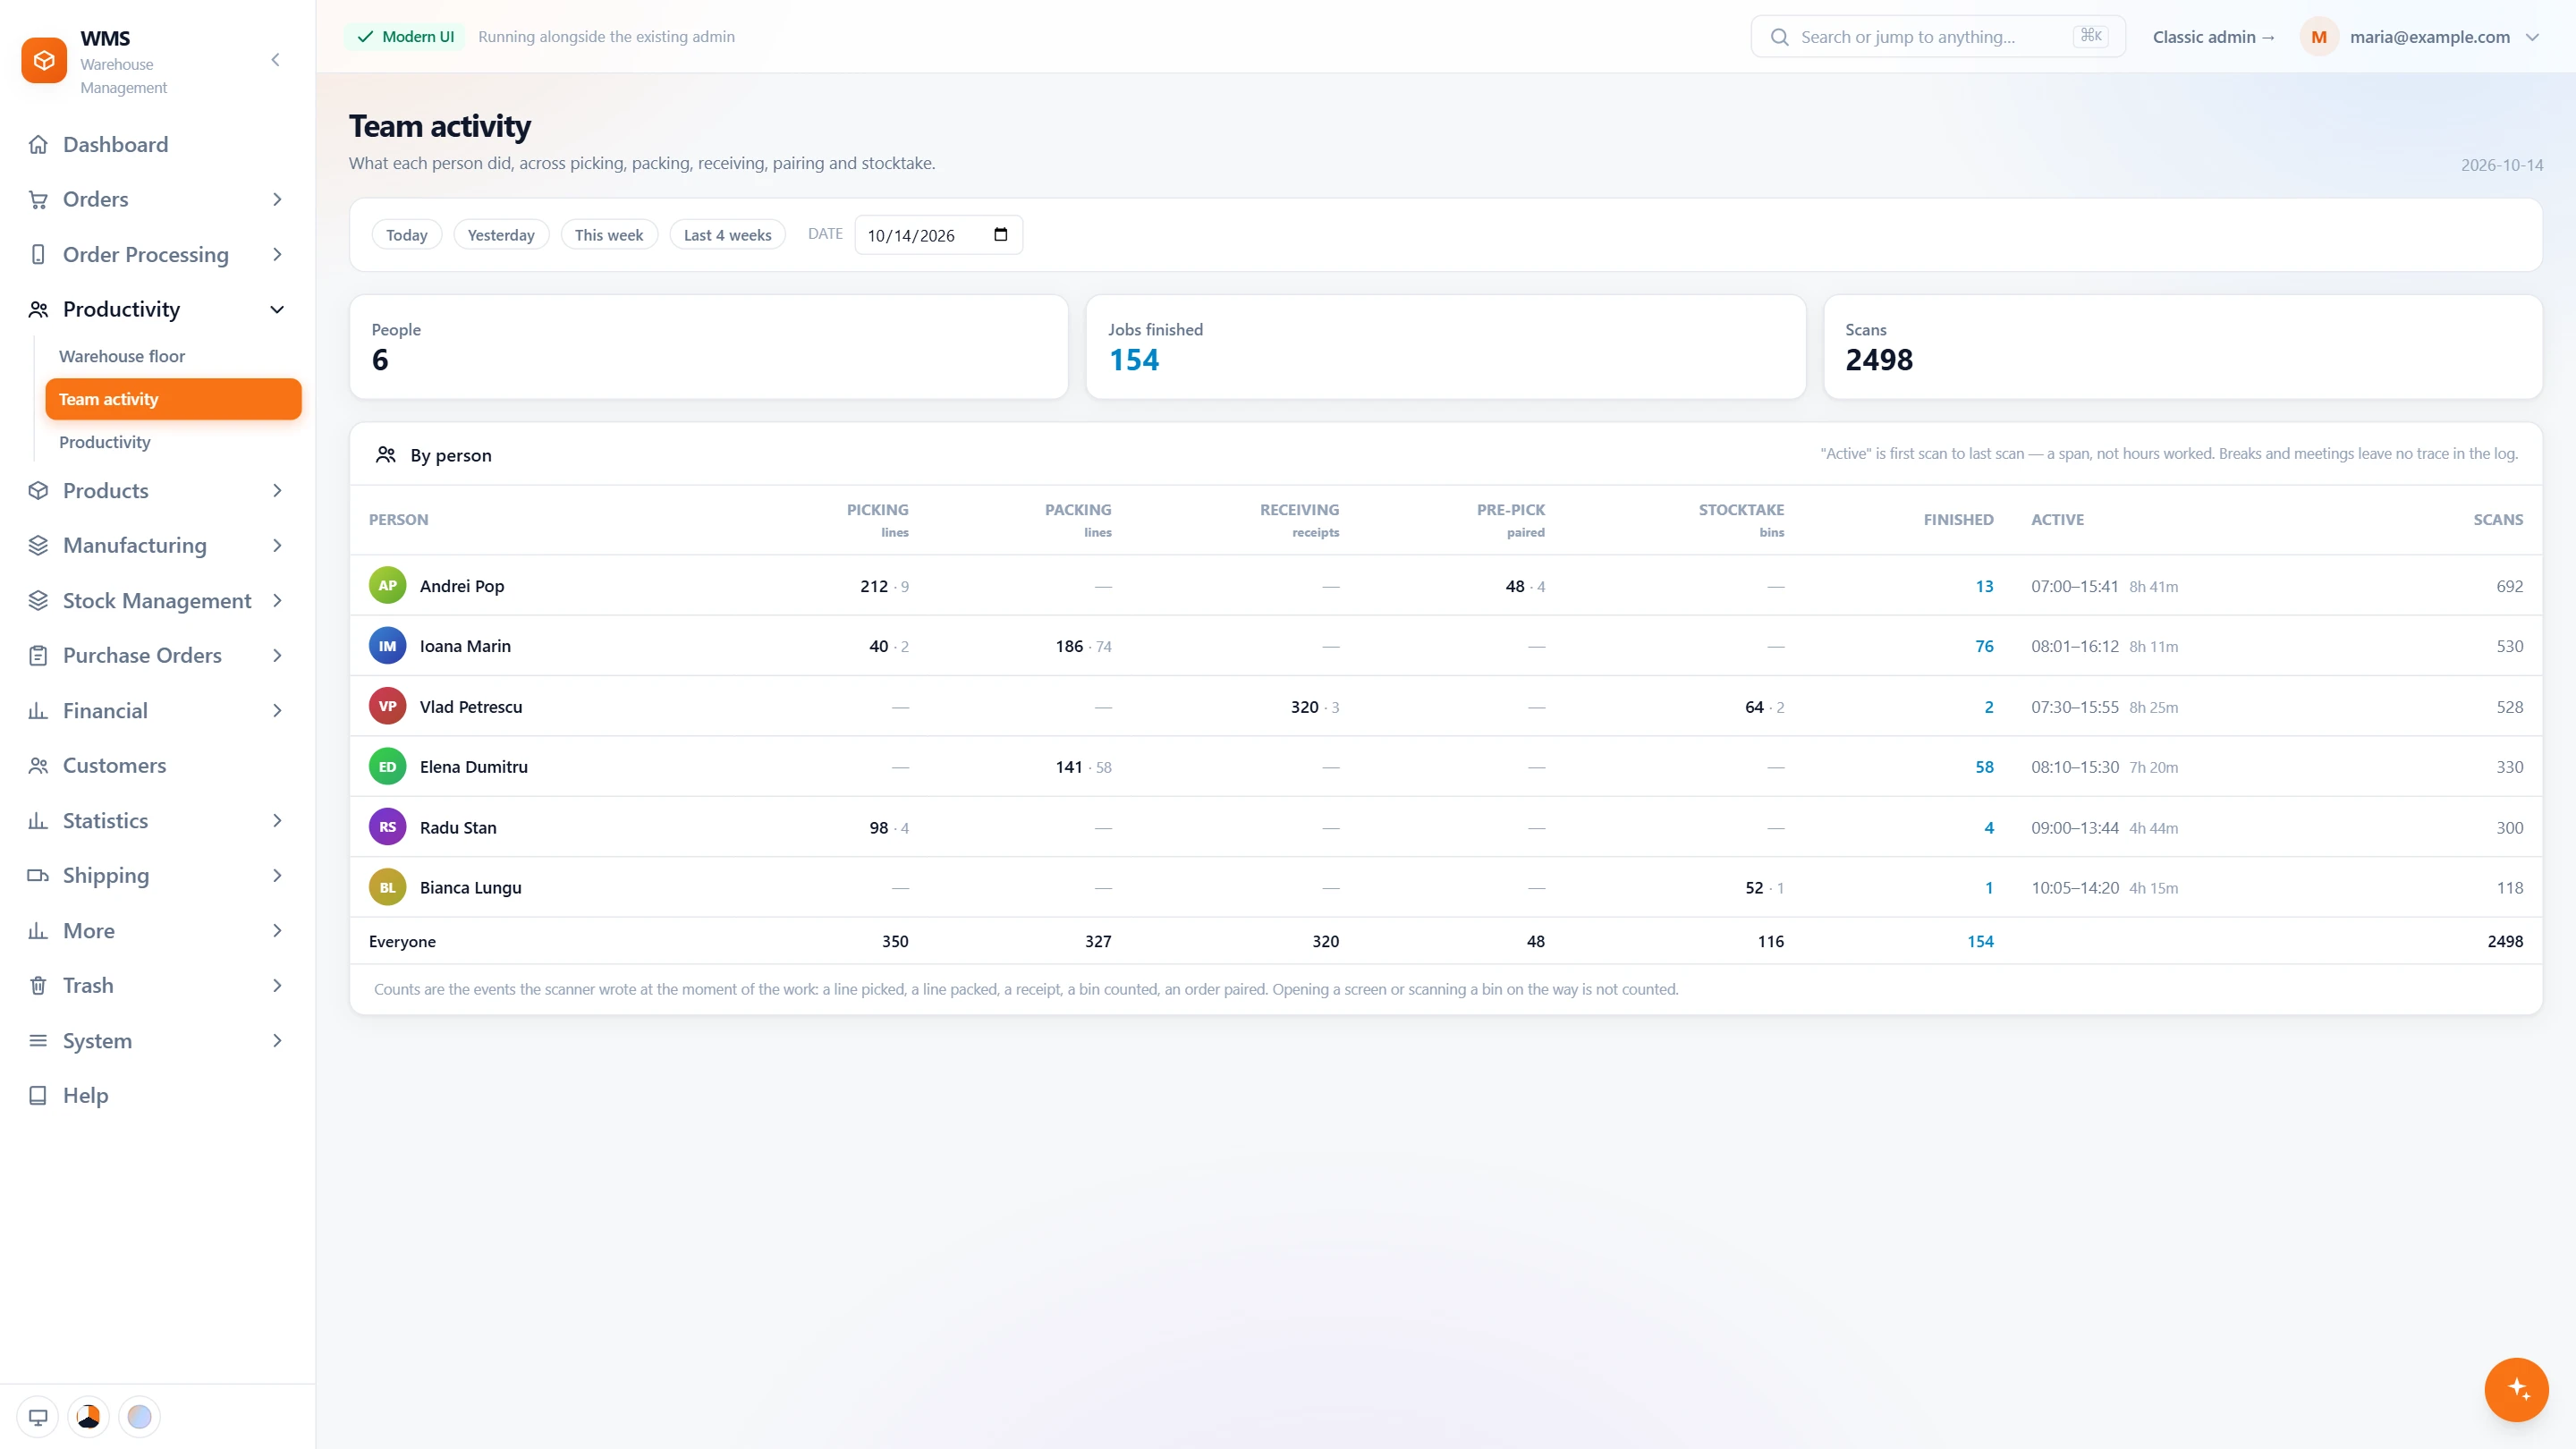
At the end of a shift, "who did what?" usually has no answer. This page lists each person's work for the day, straight from the scanner.
- Every kind of floor workNot just picking: picking, packing, receiving, pre-pick and stocktake, one column each, per person.
- Any day or periodAnswer the question for any day: today, yesterday, this week, the last 4 weeks, or a date you pick.
- Jobs finishedSee what really got done: how many lists, orders and counts each person closed, and their scans in total.
- Counted when it happenedOnly the work the scanner logged counts; opening a screen or scanning a bin on the way does not, so busy-looking is not the same as busy.
More reports
Sales, stock and the floor are usually checked in different places. These reports bring them together, so the everyday questions take a minute instead of an evening.
- One statistics screenNo more adding up figures from each shop: sales and orders, products, customers, categories, stock, fulfillment, purchasing and profit, for the period you choose.
- Best sellers and slow moversSee what to reorder and what sits on the shelf, product by product; best sellers and products with too much stock can be exported.
- Sales per channelKnow which channel earns its keep: daily sales count and value, and sales per shop and marketplace.
- Who is on the floor nowNo walking round to check: the warehouse floor board shows who is working right now, on what, and who has stopped.
- Every stock movementWhen a number looks wrong, find out why: search the movements of a product, what came in and what went out, day by day.
- Stock reports for RomaniaReady for the accountant without extra work: the stock balance and the stock card of a product over a period, the two reports Romanian accounting asks for.
What you gain
One set of figures
No more arguing over whose number is right: orders, stock and purchasing come from the same system, so the reports agree.
Fair, visible floor work
Picking and packing per person and per hour, from the scans themselves, not from impressions.
Decisions on real sales
Instead of gut feeling: what sells, what sits, and which channel earns its keep.
Questions
Can we export the figures?
Yes, so nothing is copied by hand. The best sellers and high-stock lists export to a file, and the AI assistant can answer with a spreadsheet.
Is there a start page with the day's numbers?
Yes. The dashboard shows your sales and orders at a glance, the moment you sign in.
Are the Romanian stock reports included?
Yes: the stock balance (situația stocurilor) and the stock card (fișa de magazie), ready when your accountant asks.
Related features
All featuresSee it with your own orders.
In the demo we connect your channels and walk you through this part of Pulsa on the real screens.